간단한 ML 모델을 수행하고 Metric을 뽑는 python 코드를 Github Actions을 활용해 성능지표를 출력하고 CML을 이용해 Report 형태로 출력하는 내용을 한번 다루어보고자 합니다.
우선 github-actions-cml 새 repo를 준비해둡니다.
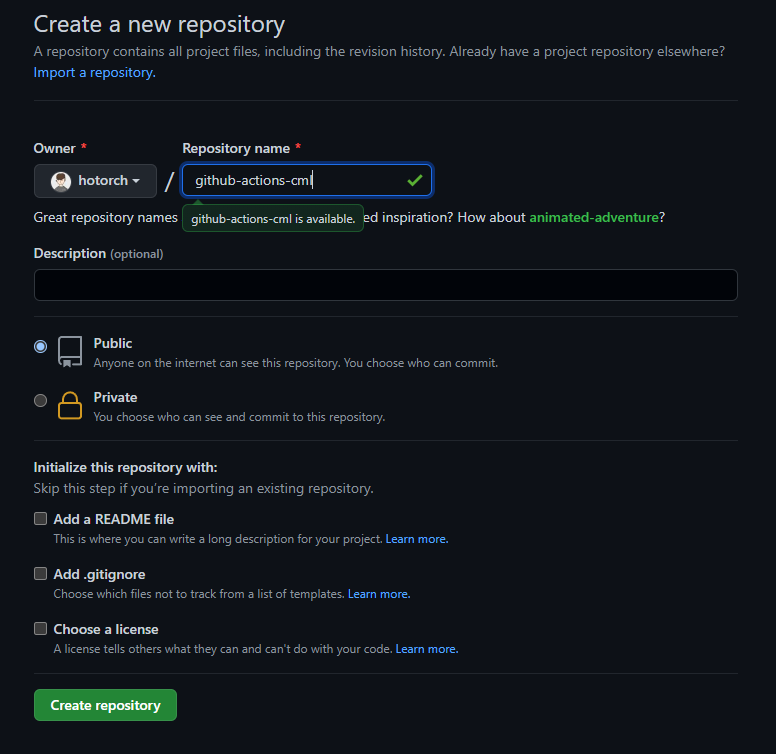
여기에서 fork를 수행하셔도 되고 zip 파일을 다운로드를 하여 압축을 풉니다. 그다음 아래 코드를 터미널에서 수행합니다. 자신의 Github Repo에 Push 해도 됩니다.
# 실습 Repo 데이터 다운로드
# 로컬에 새 폴더 생성
git init
git remote add origin <git 저장소>
git pull origin main
git checkout -b main
git config --global user.email <이메일 주소>
git config --global user.name <이름>
# 실습 Repo 의 데이터를 새 폴더로 복사
git add .
git commit -m "first commit"
git push origin main
repo는 아래와 같습니다.
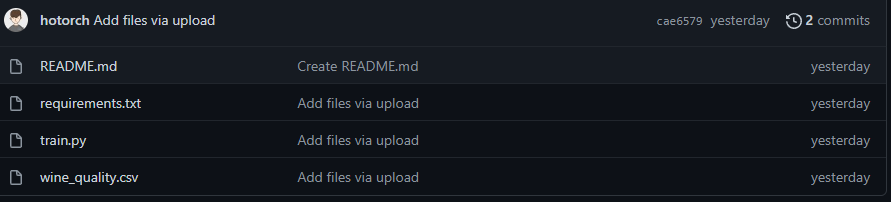
- 데이터는 유명한 Red Wine Quaility 데이터입니다.
- train.py 코드는 아래와 같습니다. RandomForest Regresser를 이용하고 Feature 중요도와 Score를 뽑는 단순한 코드입니다.
import pandas as pd
from sklearn.model_selection import train_test_split
from sklearn.ensemble import RandomForestRegressor
import matplotlib.pyplot as plt
import seaborn as sns
import numpy as np
# Set random seed
seed = 42
################################
########## DATA PREP ###########
################################
# Load in the data
df = pd.read_csv("winequality-red.csv")
# Split into train and test sections
y = df.pop("quality")
X_train, X_test, y_train, y_test = train_test_split(df, y, test_size=0.2, random_state=seed)
#################################
########## MODELLING ############
#################################
# Fit a model on the train section
regr = RandomForestRegressor(max_depth=2, random_state=seed)
regr.fit(X_train, y_train)
# Report training set score
train_score = regr.score(X_train, y_train) * 100
# Report test set score
test_score = regr.score(X_test, y_test) * 100
# Write scores to a file
with open("metrics.txt", 'w') as outfile:
outfile.write("Training variance explained: %2.1f%%\n" % train_score)
outfile.write("Test variance explained: %2.1f%%\n" % test_score)
##########################################
##### PLOT FEATURE IMPORTANCE ############
##########################################
# Calculate feature importance in random forest
importances = regr.feature_importances_
labels = df.columns
feature_df = pd.DataFrame(list(zip(labels, importances)), columns = ["feature","importance"])
feature_df = feature_df.sort_values(by='importance', ascending=False,)
# image formatting
axis_fs = 18 #fontsize
title_fs = 22 #fontsize
sns.set(style="whitegrid")
ax = sns.barplot(x="importance", y="feature", data=feature_df)
ax.set_xlabel('Importance',fontsize = axis_fs)
ax.set_ylabel('Feature', fontsize = axis_fs)#ylabel
ax.set_title('Random forest\nfeature importance', fontsize = title_fs)
plt.tight_layout()
plt.savefig("feature_importance.png",dpi=120)
plt.close()
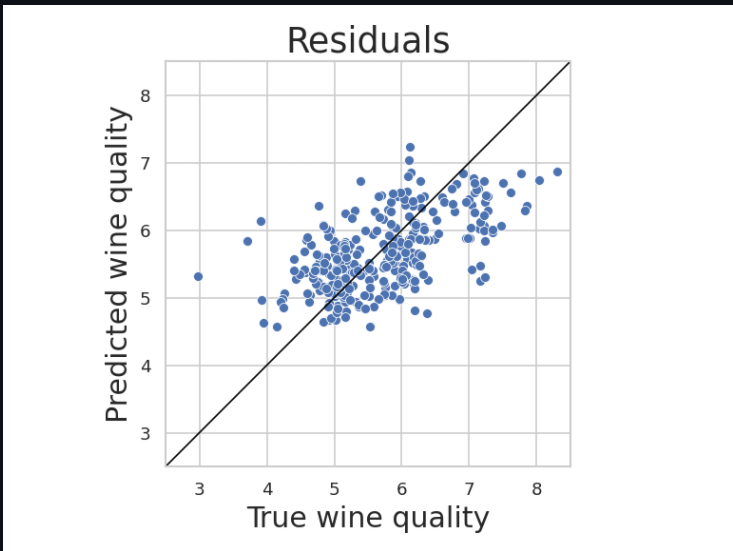
##########################################
############ PLOT RESIDUALS #############
##########################################
y_pred = regr.predict(X_test) + np.random.normal(0,0.25,len(y_test))
y_jitter = y_test + np.random.normal(0,0.25,len(y_test))
res_df = pd.DataFrame(list(zip(y_jitter,y_pred)), columns = ["true","pred"])
ax = sns.scatterplot(x="true", y="pred",data=res_df)
ax.set_aspect('equal')
ax.set_xlabel('True wine quality',fontsize = axis_fs)
ax.set_ylabel('Predicted wine quality', fontsize = axis_fs)#ylabel
ax.set_title('Residuals', fontsize = title_fs)
# Make it pretty- square aspect ratio
ax.plot([1, 10], [1, 10], 'black', linewidth=1)
plt.ylim((2.5,8.5))
plt.xlim((2.5,8.5))
plt.tight_layout()
plt.savefig("residuals.png",dpi=120)
추가로 yml 파일 하나를 생성하겠습니다. 경로는. github/workflows/cml.yml로 하겠습니다. 그 후 새로운 브랜치를 만들어서 commit 후 build 하겠습니다. (들여 쓰기를 주의하시길 바랍니다.)
name: model-training
on: [push]
jobs:
  run:
    runs-on: ubuntu-latest
    steps:
      - uses: actions/checkout@v2
      - uses: actions/setup-python@v2
      - uses: iterative/setup-cml@v1
      - name: Train model
        env:
          REPO_TOKEN: ${{ secrets.GITHUB_TOKEN }}
        run: |
          pip install -r requirements.txt
          python train.py
            echo "MODEL METRICS"
            cat metrics.txt
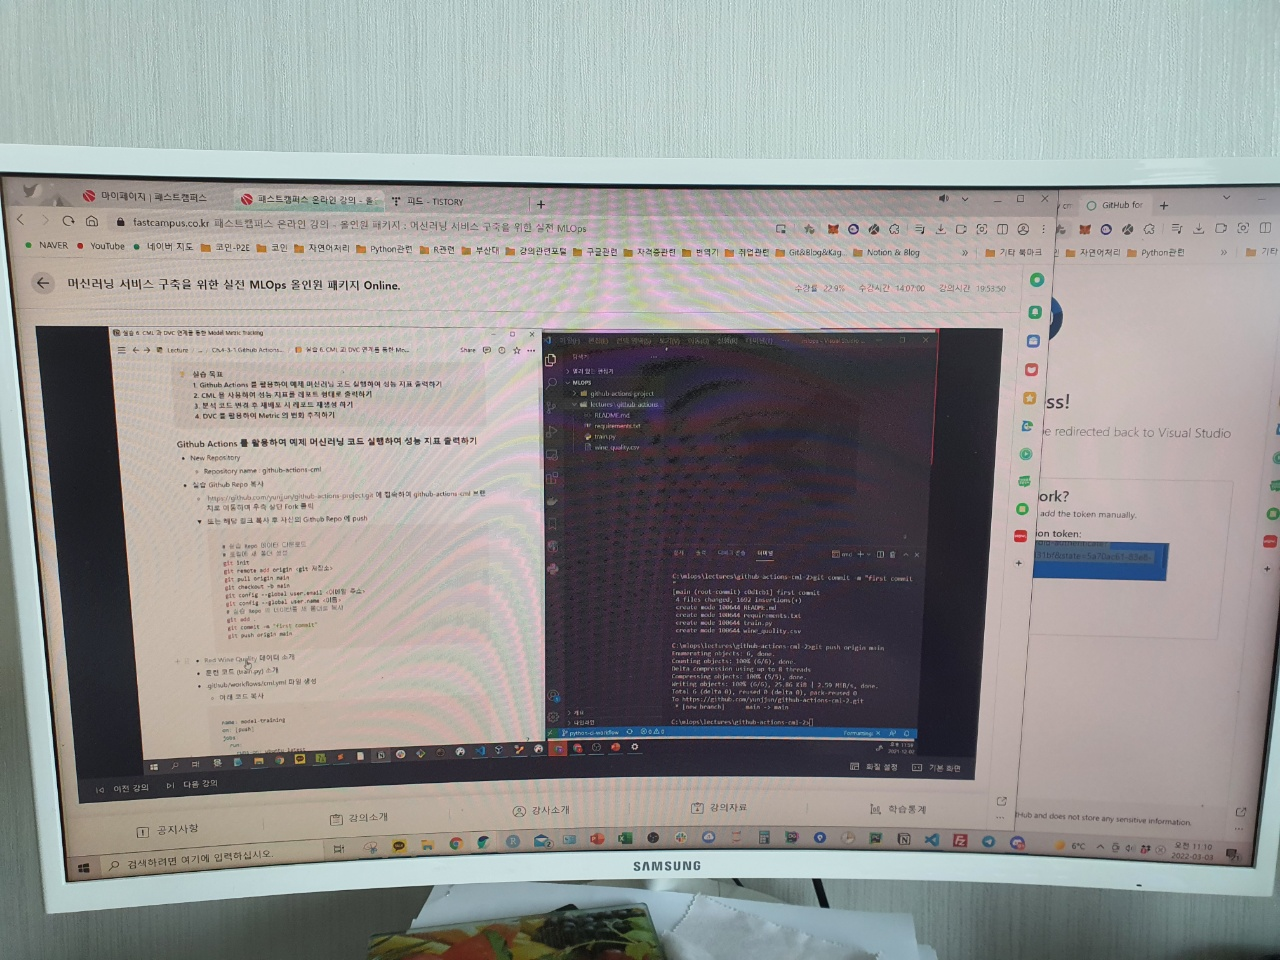
수행하면 시간이 다소 걸립니다.
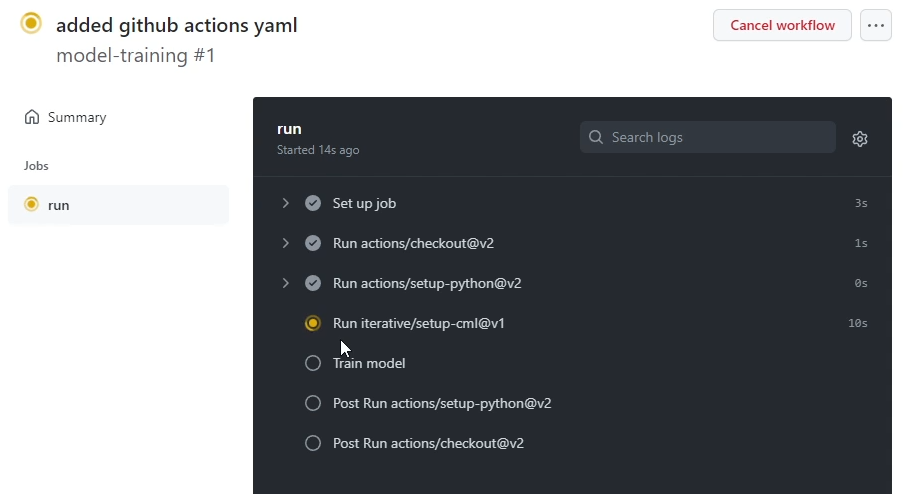
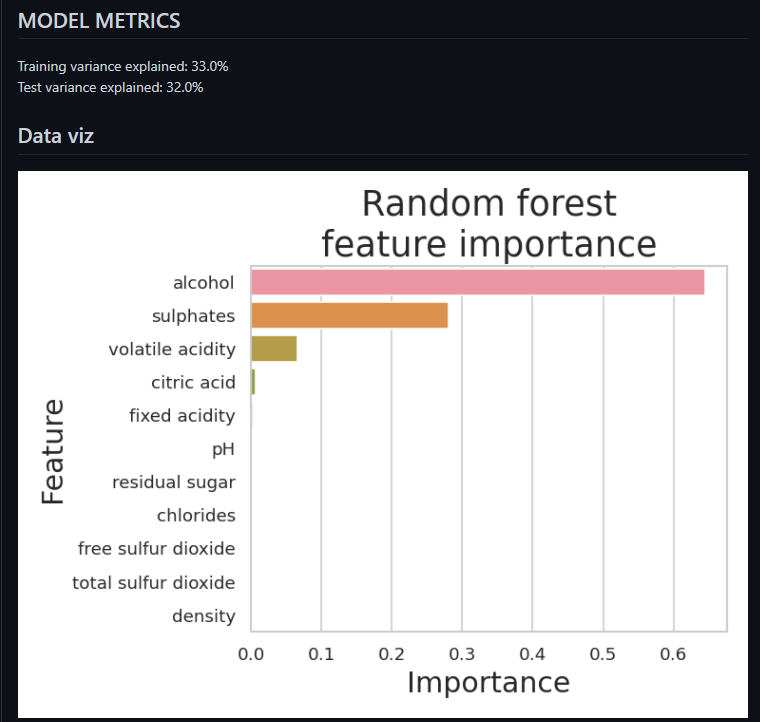
수행 후 한번 Train Model 부분을 한번 확인해보겠습니다. 아래쪽에 설명력 부분이 print 되는 것을 확인할 수 있습니다.
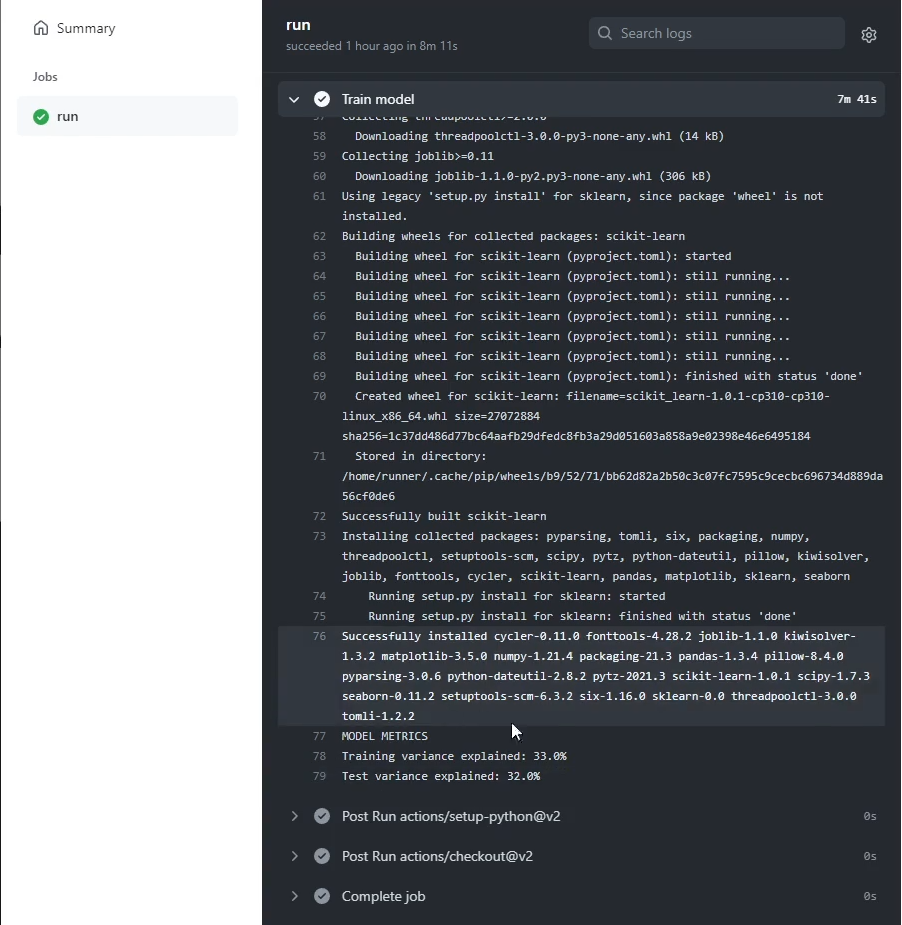
이런 식으로 출력해서 보는 것이 아닌, 조금 더 개선된 방법을 하나 소개하고자 합니다.
CML은 데이터 사이언스 프로젝트를 지속적으로 통합시키기 위한 오픈소스입니다. 아래는 cml functions입니다.
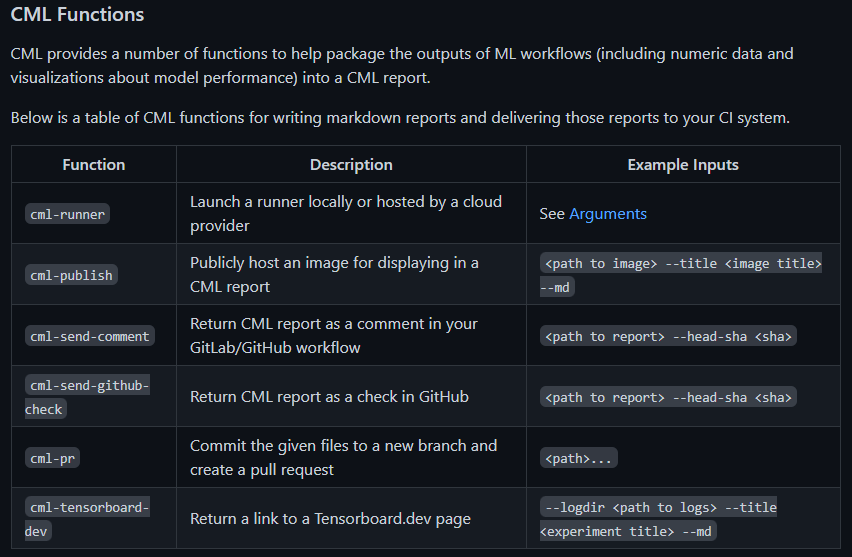
위 함수를 이용해서 markdown 형식으로 내보내겠습니다.
echo "## MODEL METRICS" > report.md
cat metrics.txt >> report.md
CML Command를 사용하여 분석 결과 이미지를 Markdown 형식으로 내보낼 수 있습니다.
echo "## Data viz" >> report.md
cml-publish feature_importance.png --md >> report.md
cml-publish residuals.png --md >> report.md
cml-send-comment report.md
최종적으로 yml 파일을 정리하면 아래와 같습니다. 이대로 다시 Build를 해보고 Commit 한 부분을 한번 살펴보겠습니다.
name: model-training
on: [push]
jobs:
  run:
    runs-on: ubuntu-latest
    steps:
      - uses: actions/checkout@v2
      - uses: actions/setup-python@v2
      - uses: iterative/setup-cml@v1
      - name: Train model
        env:
          REPO_TOKEN: ${{ secrets.GITHUB_TOKEN }}
        run: |
          pip install -r requirements.txt
          python train.py
          echo "## MODEL METRICS" > report.md
          cat metrics.txt >> report.md
          echo "## Data viz" >> report.md
          cml-publish feature_importance.png --md >> report.md
          cml-publish residuals.png --md >> report.md
          cml-send-comment report.md
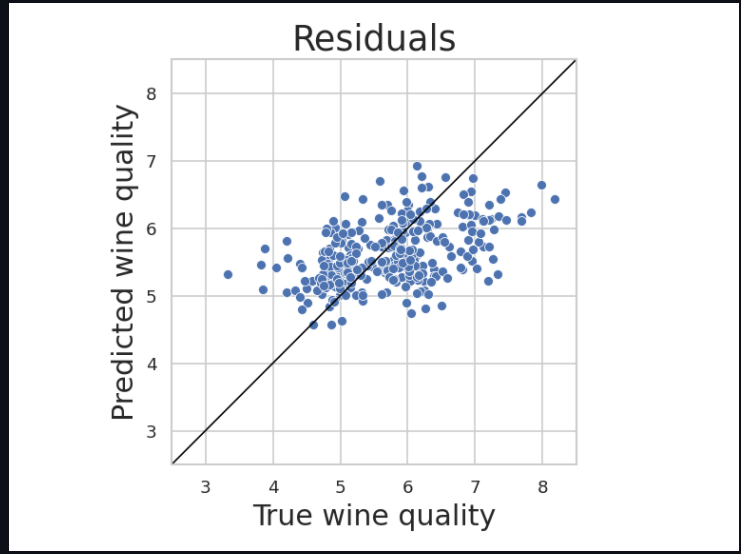
markdown으로 떨어진 것들을 한번 확인해보겠습니다.
여기서 분석 코드를 변경하고, Commit을 변경하고 다시 Build를 해보겠습니다. train.py에서 max_depth parameter를 2에서 5로 바꾸고 다시 시도합니다. 중요도 부분에서 조금 다른 형태가 나옴을 알 수있고, 설명력 부분 값들도 바뀐 것을 알 수 있습니다.
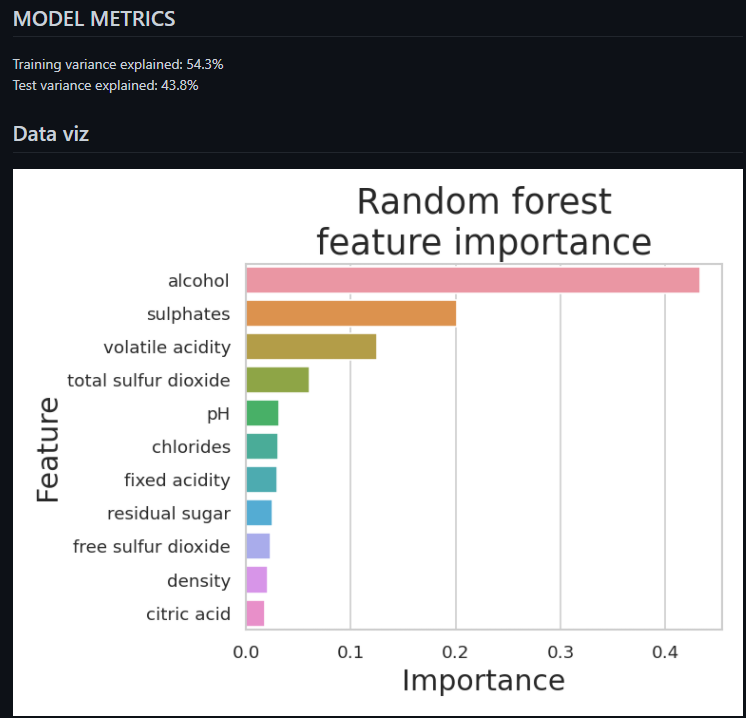
CML을 활용하면, 커밋한 내용들을 하나씩 보면서 실험한 내용들을 확인할 수 있습니다. 다음 글에서는 DVC를 활용하여 Metric을 Tracking 하는 글로 뵙겠습니다.
패스트캠퍼스 [직장인 실무교육]
프로그래밍, 영상편집, UX/UI, 마케팅, 데이터 분석, 엑셀강의, The RED, 국비지원, 기업교육, 서비스 제공.
fastcampus.co.kr
* 본 포스팅은 패스트캠퍼스 환급 챌린지 참여를 위해 작성되었습니다.
 |
 |
'AI > MLOps' 카테고리의 다른 글
| [패스트캠퍼스 챌린지 42일차] Jenkins (0) | 2022.03.06 |
|---|---|
| [패스트캠퍼스 챌린지 41일차] Model Tracking - DVC (0) | 2022.03.05 |
| [패스트캠퍼스 챌린지 39일차] Github Actions CICD - Push (0) | 2022.03.03 |
| [패스트캠퍼스 챌린지 38일차] Github Actions CICD - Build (0) | 2022.03.02 |
| [패스트캠퍼스 챌린지 37일차] ML Workflow (0) | 2022.03.01 |